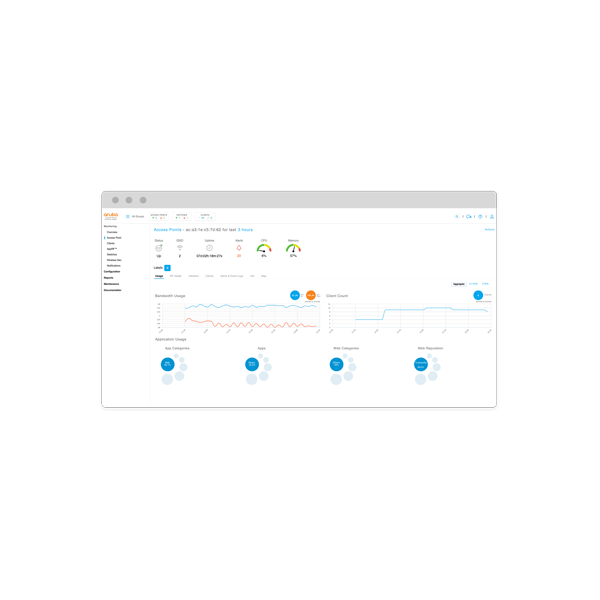
Aruba Device and client monitoring
The Clients page displays the details of clients connected to the devices in Aruba Central and their connectivity status.
Availability:
In stock
SKU
Aruba-112
Time Range Filter
By default, the graphs on the Clients page are plotted for a time range of 3 hours. To view the graphs for a different time range, click the Time Range Filter link. You can choose to view graphs for a time period of 3 hours, 1 day, 1 week, 1 month and 3 months.
However, the Distribution data (Client OS) under the Distribution tab does not honor the time range you selected in the time range filter.
Total
Displays the total number of clients.
Wireless
Displays the total number of clients connected to wireless network.
Wired
Displays the total number of clients connected to the wired network.
Remote
Displays the total number of remote clients connected through VPN.
| Brands | Aruba |
|---|
Write Your Own Review

 UAE
UAE KSA
KSA


